This is the final post in the Knowledge Graph Best Practices series. We hope this series has empowered you with enough information to be successful in setting up your first knowledge graph project.

Ironically, the biggest challenge you might face to getting a knowledge graph project underway is getting access to the source data! This is more common than one might think, and it reveals an interesting truth. People know intuitively that data is valuable, and its value creates interesting dynamics. This is partly why we say culture can be more important than technology. So when preparing your project, ensure that you have access to the data sources you need.
To implement, demonstrate and manage your knowledge graph, you need appropriate software. While it is true that one can encode a knowledge graph using a text editor, that would be tantamount to boiling the ocean. A number of commercial and open source software solutions are available. Open source software tends to be more developer-oriented, and commercial software tends to be more abstracted, scalable and maintainable. You basically are going to pay people to develop your knowledge graph solution, or pay a license to those who have already developed a solution platform.
I’m biased, but I recommend the former.
Why? Knowledge graph is something of a paradigm shift for data. As such, your risk is considerably higher than continuing the status quo. Engaging with a commercial company provides you access to grizzled veterans who understand deeply the tactics, techniques and best practices. They share a mutual interest in your success. The use of a commercial solution platform will allow you to focus on rapid time to value and business outcomes.
Know what you want to show end users and stakeholders
Our experience is that technical audiences appreciate the strategic value more than users or executives. So they can be an ally or an obstacle. From experience, it seems like end users and decision makers should be the primary targets.
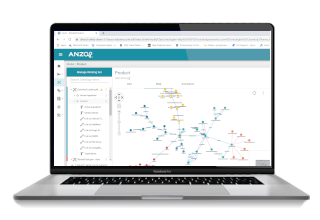 Think about the user interfaces you plan to show. Displaying dense graphs of nodes and edges — fuzzballs — is not going to win the audience. A simple tabular display of semantically integrated data from multiple sources can be more effective. From various columns in the table, provide links that drill into linked information. This simple approach can be powerful for people who spend a lot of time querying multiple systems, aggregating data from those systems, and then organizing the data for use. It quite literally displays multi-source data in one view.
Also prepare traditional charts and graphs. Bar charts, line charts, bubble diagrams, heat maps, etc are familiar and relatively easy to understand. Your challenge is to show how easy it is to feed those views from multiple sources. Remember, knowledge graphs are about processing data and they enable more effective and efficient analysis.
Another aspect of your demo should highlight relational navigation. You might call these filters. Your demo should provide multiple views along with user-configurable filters that allow them to rapidly select and narrow down displayed information. These are essentially highly parameterized questions.
To be sure, users and developers will say things like, “We already have filters.” True, but a good knowledge graph application will dynamically create filters from the knowledge graph. In other words, the filters come from the data, not prebuilt application-specific rules. This creates a new capability for users (and automated clients) to easily ask unanticipated questions! Which further empowers end users to be more self-sufficient.
Think about things like hypothesis testing or discovery. Knowledge graphs allow users to ask questions of the entire knowledge graph and in arbitrary combinations. This is new.
What are common reasons for project delays in your organization?

As this Knowledge Graph Best Practices series concludes, popular next steps are circulating the O’Reilly Knowledge Graph Ebook and demoing our knowledge graph platform Anzo.
If you’d like to speak to one of our knowledge graph experts, simply fill out the form on this Anzo demo web page and we will do our very best to hold your hand through your knowledge graph journey.
Knowledge Graph Best Practice Series
- Building Momentum | Educating others about knowledge graph and getting support for the project
- Selecting Your Fist Use Case | Set up for success
- Assembling the Team | Required roles and skills
- Preparation | What to do before you begin to avoid delays