This post was originally posted on my, Ben Szekely's, Medium blog early in 2020. I recently had several conversations with leaders in the healthcare and retail industries that reminded me how relevant this content still is today.
At Cambridge Semantics, we have built our company on the vision that the semantic graph data model uniquely accommodates the speed and complexity of modern data integration initiatives, and therefore, scaling graphs has become imperative for us and our customers. However, this capability is much in question in the marketplace.
I was on the phone with a leading industry analyst this past week, listening to him describing the numerous calls per day from customers related to data fabric and the role of graph technology therein. A central question all customers had posed to him, and in turn, him to me, was
“Could graph truly handle data integration at scale?”
As a proxy for this topic, customers and prospects often ask us “How many triples or nodes/edges can you load and query in your triple store or graph database?” I’ll explain why this isn’t the right question to ask in getting the complete picture of scaling graph for data integration, and how AnzoGraph and Kubernetes change the narrative.
In this article, we will learn about:
- The integration requirements for the Enterprise Data Fabric
- How Semantic Graph Models uniquely address these requirements
- Anzo’s capabilities enabling graph-based data integration at enterprise scale
- The role of Kubernetes in our approach
- Real-world use cases
Executive Summary
Leaders have expectations of speed, flexibility and scale for their digital transformation initiatives. Central to meeting those expectations is the ability to integrate data across the business rapidly, while dealing with complexity and uncertainty. A modern data management strategy, often referred to as “The Enterprise Data Fabric”, provides this capability by meeting the following requirements:
- Moving fast in the face of real world data complexity
- Presenting data sets and data products using common business data models
- Addressing unanticipated questions and requirements.
At Cambridge Semantics, we believe effective use of semantic graph data models for both data and metadata is the best way to meet these data fabric requirements.
- Semantic graphs represented in RDF and defined by OWL models (ontologies) are highly flexible and do not require users to pre-define them prior to onboarding data or knowing analytic requirements.
- Semantic graph models fundamentally support the expression of models in business terms.
- Semantic Graph models were designed for unanticipated questions.
Most data fabric analyst research recommends graph technology for metadata management and cataloging. Semantic graph models are indeed well suited for these components of the fabric, but many perceive “graph databases” to be unsuitable for integrating data itself because of their inability to scale and inaccessibility to end users. By combining our massively parallel processing (MPP) in-memory graph engine with Kubernetes cloud automation, Anzo delivers a rich integration layer for the data fabric that truly addresses enterprise scale data integration.
We have proven this capability with our customers across industries with data fabrics addressing large-scale use cases including:
- Fraud detection and monitoring within Financial Services.
- Integration of clinical and research data within BioPharma.
- Customer 360 across industries
Each of these use cases includes dozens of data sources, complex data integrations and billions of data points connected and integrated with semantic graph models.
Integration Requirements for The Enterprise Data Fabric
The Enterprise Data Fabric is an architecture for modern data management that anticipates the need to connect data across the enterprise at speed and scale.
The following requirements triangulate scale in the context of the data fabric.
-
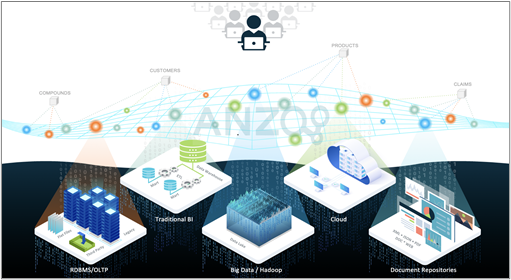
Central to the success of any data fabric is an agile integration overlay that blends complex and diverse data into easy-to-consume data products for end-users, data scientists, and applications. This integration layer must be scalable and automated — table stakes for any modern data architecture. Integration in the data fabric must be fast and flexible in the face of complexity and change. The enterprise data landscape includes many sources of data, both modern and legacy, both in the cloud and on-premise. These sources include data warehouses, transactional databases, data lakes, document repositories, cloud applications, and file systems. The sources have many different file formats, APIs, physical models, and logical models. The data fabric simplifies integration to allow new sources to be added quickly.
-
The data fabric presents data based on common models described with business concepts — the way people think about the data itself, as well as the connections between data sources and data elements. Data consumers use these common models to access data sets or combinations of data most important to their analytic tasks. Applications tie into feeds based on these common models as required.
-
The data fabric must address unanticipated questions and requirements. Traditional data integration approaches, including warehouses, were designed to accommodate pre-defined sets of business questions based on known data sources. The data fabric, which integrates all the data in the business, adapts to new questions, and to new models and ways of looking at the data on the fly. The data fabric accommodates new analytic use cases and initiatives without starting from scratch. The data fabric “inverses” the traditional application development process and yields an ad hoc “question-and-answer” layer, which empowers users to “know what the enterprise knows.” Each time a user has a new question, IT is no longer required to prepare the data to answer the question.
Approaches to the data fabric based on relational or rectangular data models including databases or data lakes cannot, on their own, meet these requirements. You can expand further on this topic with the white paperThe Six Essential Requirements for Scalable Knowledge Graphs.
Why Semantic Graph for Integration?
The Cambridge Semantics team has been applying graph data models to data integration for almost two decades, beginning with our early research at IBM leading up to our founding in 2007. As research firms including Gartner and Forrester have identified graph as a central capability in the data fabric, the centrality of graph technology for data integration is growing in prominence. As our name suggests, we specifically mean semantic graph data models based on the W3C Semantic Technology standards of RDF, OWL, and SPARQL.
While LPG-only databases have been applied to analyzing already integrated data with graph algorithms in products like Neo4J, their utility for actually integrating data is limited. The vertex/edge data model requires the user to pre-define node and relationship types based on known analytic requirements. These graph definitions are limited and highly technical in nature, suitable for data scientists writing specific analytics, but not broad data integration and delivery at enterprise scale. Semantic graphs, on the other hand, directly address the three integration requirements above:
-
Semantic graphs represented in RDF and defined by OWL models (ontologies) are highly flexible and do not require users to pre-define them prior to onboarding data or knowing analytic requirements. Ontologies adapt easily to accommodate new concepts and properties, as well as connect to new or related ontologies to expand the set of connected data in the data fabric. Semantic graph models using OWL also contain descriptive and unambiguous modeling capabilities to address the complexity and nuance of diverse data.
-
Semantic graph models fundamentally support the expression of models in business terms. Concepts, called Classes define what each node in the graph represents, and Properties define the meaning of edges as well as the attributes of nodes. Collections of related Classes and Properties and their characteristics make up an Ontology that provides meaning defined outside of the graph itself. Ontologies, therefore, support inheritance, linkages, and reuse to facilitate a connected business level definition of all an enterprise’s data assets.
-
Semantic Graph models were designed for unanticipated questions. Unlike relational schema or LPG definitions constructed for a known universe of questions, semantic graph models allow users to pivot their questions by following relationships in the graph. The semantic models allow users to make sense of these relationships in asking their questions. When requirements change drastically, semantic models also allow dynamic remodeling of data to support new types of questions, analytic roll-ups, or simplifying the context for a particular audience. When multiple data sources are connected in the semantic graph, dead-ends in the data vanish; the unanticipated becomes the intuitive. Semantic Graph models embrace uncertainty. Whereas relational models implicitly assume the model is “correct,” semantic graph models assume they never have all the information, so they expect the unexpected. Just as data changes, so do our models when we learn new information, crises appear, and new requirements emerge.
For a more eloquent treatment of why semantic graph models are critical for the data fabric, see this blog by my colleague Barbara Petrocelli.
How does Cambridge Semantics make this work at scale?
Most analyst research focuses on the use of knowledge graphs for metadata management and data cataloging in the data fabric. We believe that is an important foundation, but it misses graph’s true calling which is integrating the data itself. Based on the data fabric requirements and capabilities above, graph must scale for both metadata and data.
Metadata
Our Anzo product uses semantic graphs to manage and model all metadata throughout the data fabric including source system metadata, business concepts, ontologies, transformations, rules, analytics, access control and even underlying cloud infrastructure. Apart from a convenient, self-similar architecture and programming model for our development teams, the use of a semantic graph model for the metadata catalog affords an abundance of external benefits.
First, imagine a data fabric established organically, over time, decentralized, and collaborative, instead of a centralized, top-down data management strategy (a la the data warehouse) that is out of date by the time it’s “completed.” As users work with the Anzo catalog user interface to onboard, model, blend and access data in the fabric, they are actually interacting with a complex and well-described semantic knowledge graph behind the scenes. This knowledge graph facilitates collaboration while it captures everything each user does to integrate data sets to support security, governance, and efficient reuse.
Second, Anzo’s approach organizes metadata based on reusable business concepts. This architecture, which we call a metadata hub, allows for an increasing degree of automation over time. As the fabric grows, schemas, mappings, data sources, and models accumulate around common business concepts at the center of the hub. Each new onboarding activity requires less manual effort, taking advantage of the underlying metadata. Look for a blog on this topic soon.
Finally, by using semantic graphs for metadata, Anzo delivers a degree of openness we often hear our customers missing in other solutions and products. All aspects of the data fabric are described in RDF and OWL and can be accessed through SPARQL, Command Line or REST APIs. We never want to hear customers thinking about a future after Anzo, but we like that our open metadata model gives them comfort in the ability to integrate with other catalogs and migrate functionality to other tools, as required.
Data
As important as effective use of metadata is for the data fabric, the data fabric is all about, well, the data itself. Solutions that use graph only to catalog data sources, manage models and vocabularies, or virtualize queries fall well short of realizing the true value of graph.
The question of whether or not graph can actually scale to represent, integrate, and query all of the data itself, is, of course, a legitimate one when you consider the long history of graph approaches that have failed at true scale. These anecdotes generally land in one of two buckets.
The first, representative of where we all started back in 2003, layers a graph API and query compiler on top of an existing non-graph database. We struggled with many such combinations at Cambridge Semantics on the path to where we finally landed, and I find it amazing to hear people still trying this today. That approach did not work well in the beginning with relational back-ends, and it still does not work well with NoSQL or document back-ends today. While potentially workable for certain graph use cases that happen to hit the sweet spot of the underlying database technology, the dynamic nature of graph interaction means that your data and query will easily miss this sweet spot, crippling the underlying store and defeating the purpose of graph: flexibility. The second bucket comprises LPG-focused graph databases, many of which are restricted to single-node OLTP-style architectures. Many of these products offer packages and simplified tooling for developers to get started with graph, but most run out of steam long before solving enterprise-scale data integration use cases.
And thus AnzoGraph. Circa 2013, as data lakes and Hadoop expanded expectations of “big data” scale, our customers required increasingly larger data sets in their graphs accompanied by increasingly complex data integration and analytic queries. Even the embedded OLTP native semantic graph database that CSI used at the time did not provide the required scale. Therefore, we partnered with a team that had already built large scale analytic databases including Netezza and Amazon RedShift to develop AnzoGraph, the MPP graph database that would scale to 100’s of billions and even trillions of RDF triples. We weren’t the first to stand-up a triple store and stuff it with this volume of data, but we were the most successful in the context of the trillion-triple challenge to performantly query that size graph with meaningful queries, including joins, aggregations, analytics, and inferencing.
AnzoGraph loads data into memory in parallel from disk or APIs at millions of triples per second per node in the cluster, sharding data automatically with no indexes or user input required. AnzoGraph executes queries in parallel, using every core in the cluster — up to 100’s of nodes and 1000’s of cores. If any particular query isn’t returning fast enough, simply add more compute. All queries run in parallel, regardless of the constructs used! I could go on, but I won’t.
Ok great, so we have an MPP graph database that can scale to accommodate any amount of data and any analytic or integration query. Now what?
Anzo harnesses the power of AnzoGraph to let everyday users integrate data within the graph. Oversimplifying, Anzo uses the metadata capabilities described above to manage the process of constructing, transforming, securing, and querying the graph. A deep-dive on the features of Anzo is not the purpose of this article, but I will discuss, through the lens of one of its central features — the Graphmart — how Anzo integrates data.
The Graphmart
The graphmart is a metadata-driven structure in Anzo where users organize, combine, connect, and transform data from different sources with a novel construct called “Data Layers.” Each data layer in a graphmart contributes a logical sub-graph to the overall graphmart. Each layer is individually secured and may be turned on and off dynamically. Anzo uses the set of layers in the graphmart to load data into AnzoGraph or run queries to transform the graph, creating new RDF triples in memory. The power of the underlying AnzoGraph engine allows the graphmart to manage 10s to 100s of billions of RDF triples across as many sub-graphs as required while allowing users to iterate quickly on their graphmart design and data model.
Users query the graphmart from any data science or analytics tool via OData or SPARQL, or directly within Anzo’s exploratory analytics environment. The graphmart queries all layers based on user permissions.
A central R&D focus at CSI is to enhance these data integration capabilities by adding options for loading data for integration into graphmarts, and I’ll discuss that a bit here.
Onboarding data into RDF with Spark
Anzo currently supports “Load Layers” in the Graphmart that instruct AnzoGraph to parallel load compressed RDF files from Anzo’s cataloged disk storage. As shown in the figure above, Anzo uses Spark to create these compressed RDF files on disk. This practical approach has proven to work exceptionally well, and allows data engineers to quickly build the graph directly from sources or from raw data already landed in their data lakes. You might think of this as an “ETL”-like approach, as it allows users to define ETL-style mappings within the pipelines as the RDF is created. Alternatively, many Anzo users apply this approach for ELT — choosing a direct load into RDF, and applying transformation in the AnzoGraph cluster (see below).
Parallel loading direct from source to AnzoGraph
Coming later this Summer, graphmarts will allow users to configure data layers to load non-graph data directly from sources including data lakes, data warehouses, databases, and APIs, transforming the data to RDF as it is loaded into memory. The graphmart figures out how to partition the source system queries to enable the parallel load. What we found is that AnzoGraph’s MPP loading capability that works so well loading RDF from disk, works just as well loading in parallel from non-graph sources. This new capability opens many possibilities for faster “ELT” while avoiding data movement.
Virtualization with Views
Many semantic technology practitioners have turned to federated or virtualized approaches because they lack a scalable enough graph database. Even with the speed and scale of AnzoGraph, we are developing a virtualized option on top of onboarding and direct loading. Users will be able to define View Layers that query non-graph data sources at query time. Intelligent push-down optimization delegates filtering to the source system, avoiding data movement and expensive high-volume joins where possible.
For more details on these upcoming features, see my recent blog post on MPP Data Virtualization. To summarize, these capabilities offer complete flexibility for integrating data in the semantic graph. The example below illustrates how parts of the semantic graph model load from different sources.
From the User’s standpoint, all data is queried and analyzed through graph models in the same way. In particular, users can access the integrated data from any BI or analytics tool, without requiring specialized skills or graph query language knowledge.
Data Layers for Integration — Piling on the “T”
Once the data from individual sources are loaded into the graphmart, through either of the philosophically ETL or ELT approaches above, it’s time to pile on the “T” to integrate the graph models from each source. Users define additional data layers to harmonize data across these different sources. In the example above, transformation steps establish a canonical Patient node and connect relevant data from each part of the graph model. These steps also run in parallel in memory, allowing users to rapidly iterate on their integration approaches on the full-scale data sets. The semantic graph models ultimately allow a level of fidelity capable of representing data connected across many sources.
Sean Martin, CTO of Cambridge Semantics, has published an incredibly detailed article about integrating data in the graph.
Kubernetes: Why “How many triples can you store?” isn’t the right question.
At this point, you might be wondering how we manage all the compute required to support all of this loading and integration across data sources, users and use cases in an enterprise data fabric. This question is often expressed by prospects and customers in variants of “How many triples can you store in Anzo”? Such a lens is natural. The semantic technology and graph database markets have typically oriented people around the notion of a graph database or a triple store. How much can it hold? How much can it query? As it turns out, AnzoGraph does both better than anything else. With horizontal scale, we have turned up the dial to 1 trillion triples in memory and queried it orders of magnitude faster than other approaches. Typical customers today are in the 10’s of billions and growing for interactive query. But even with AnzoGraph’s breakout load and query capability, the traditional “single cluster or database” mindset breaks down for enterprise data fabric scale integration.
The right question to ask is “How do I get the right data into the graph, with the right semantic model, with the right compute, at the right time?” Graphmarts are all about answering this question. The fast loading and modeling in the data layers take care of the data and the model bits. But what about the “right time” and “right compute?” Enter Kubernetes. Instead of maintaining a single cluster or database that must anticipate the eventual data and query needs of all users, Anzo uses Kubernetes to deploy AnzoGraph clusters automatically based on the requirements of the graphmart and their users. Subject to policy and budget, individual users may even enjoy the benefits of a dedicated cluster for large data sets and complex integrations or analytics. When the users “activates” their graphmart, in the time it takes to grab a coffee, Anzo:
- invokes a Kubernetes operator to deploy the right-sized AnzoGraph cluster
- loads the data from onboarded files or direct from source (options above)
- runs data layers to connect, integrate and transform the data
- notifies the user their graphmart is ready
Activations can also be automated of course, based around working hours and peak usage. Kubernetes provides Anzo with all the usual benefits of cloud service cost reduction, ease of maintenance, and continuous choice of cloud providers.
A few examples
So, how is this applied in the real world? Cambridge Semantics has proven graph capable of integrating data at scale. I’ll share a few examples here to conclude.
Insider Trading Surveillance
Financial services firms, including hedge funds, use the data fabric to integrate and model data coming from a variety of sources including:
- trading data
- pricing data
- electronic communications (chats, emails)
- login data
- badge swipes
- call logs
The semantic graph model connects all this data in a way that makes it easy to define alerts and run analytic reports across the data. However, it’s big. Each year of data can be 10B or more RDF triples, and the firm needs to query and monitor up to 3 years at a time. Query response times need to be fast of course. But more importantly, new data comes in daily so the integration queries used in data layers to continually build the graph, need to be fast as well.
Clinical Data Unification
Several of our BioPharmaceutical customers use the data fabric to unify patient data across 100’s or even 1000’s of clinical trials. This helps them analyze data across trials for all kinds of interesting use cases beyond the intended design of the data. Repurposing or retargeting existing drugs is one such use case. The challenge lies in the fact that data collected for each study follows a set of submission standards designed to allow standardized FDA review of the given study. These standards do not, on their own, ensure the data is suitable for integrated analytics across studies. Further unification is required.
To give a sense of the scale of the problem, a single study comprises up to 100 data sets called domains, and each domain comprises dozens of columns called variables.
In one engagement, we encountered over 2 million total variables across over 80,000 domains/data sets. Manual mapping was not practical. We used a graph model to capture all of the metadata to automatically align data sets to domains. The metadata graph itself yielded 10’s of millions of RDF triples. Once we onboarded the data in a raw format, we used data layers to automatically apply a series of transformations across all studies. The integrated data graph yielded over 15 billion RDF triples. Within 2 weeks, we had unified the data sets within the required margin of error.
These are just two examples of integrating data and querying semantic graph at scale. To learn more about how we’re helping our customers, etc. visit www.cambridgesemantics.com or email me at ben@cambridgesemantics.com, I would be happy to setup demonstrations or address questions.