In 2018, industry analysts declared 2018 as the year of the graph. As we move into 2019, it is worth reflecting how the graph market has evolved.
Last year, we saw Amazon launch its own highly available graph transactional database offering, and established players like Neo4j raise significant capital. We saw major corporations use graph technology to harmonize diverse data, get better business understanding and deploy a variety of graph use cases. We saw increased adoption of graph-based industry standards like FIBO in financial services, HL7/FHIR in healthcare, and CDISC in the pharmaceutical industry.
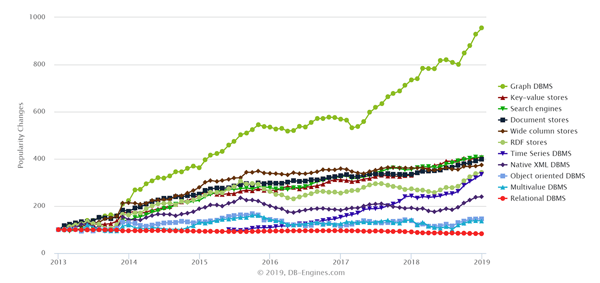
Noteworthy, however, has been the continued growth of graph databases to conduct analytics to get better insights faster (see the chart below from DB Engines).
Popularity Changes per Category, January 2019

As a part of addressing this demand, last year the Cambridge Semantics team spun-out our graph analytics database: AnzoGraph. AnzoGraph is our graph OLAP database for analytics and machine learning. We made it available to be downloaded for use behind the firewall, for automated hosted deployment in the Cloud and increasingly we are making it available in a variety of Cloud marketplaces.
For several years, AnzoGraph has been in production at major corporations as a part of Anzo, our Enterprise Knowledge Graph and integrated analytics offering. Now AnzoGraph is available as a stand-alone offering. It can work with various transactional databases to provide industry’s fastest graph analytics database at scale. Companies can add graph analytics capabilities to their existing analytics, data science or machine learning use cases or they can build their own custom analytics offering leveraging our highly scalable graph analytics database.
Why Is There A Strong Market Interest In Graph Databases And Graph Analytics?
As the sheer variety of data sources continue to rapidly expand (with unstructured data growing the fastest of all), finding machine-based insights is becoming more and more important. Graph databases provide an excellent infrastructure to link diverse data. With easy expression of entities and relationships between data, graph databases make it easier for programmers, users and machines to understand the data and find insights. This deeper level of understanding is vital for successful machine learning initiatives, where context-based machine learning is becoming important for feature engineering, machine-based reasoning and inferencing.
Not All Graph Databases Are The Same.
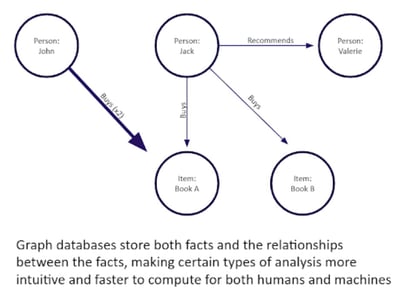
With the growth of graph, two different categories of graph databases have emerged. The initial and predominant category has been transactional graph databases, or graph OLTP databases. These graph transactional databases are excellent for building real-time applications or executing analytics on data where a specific record has to be fetched. For example, in an Amazon-style recommendation engine where you bought a particular book, the graph databases can quickly identify individual books, reviews or individual pieces of information that may be relevant to that specific book. Needs like this, should be powered by transactional (OLTP) graph technology.
 Meanwhile, graph OLAP databases are excellent for analytics on the entire dataset so as to do aggregates, link analysis, graph algorithms, inferencing and business intelligence (BI) style analytics. Think AWS Redshift but with native graph technology. AnzoGraph can do Redshift-type analytics but also graph algorithms and inferencing while additionally providing faster, easier and cheaper analysis of linked data. Examples of analysis that can be easily done with graph OLAP databases: interactive analysis of all buyers who bought book X and those who also bought related books, either sorted by the same author, similar topic, or recommended buy list; and aggregates in real-time of book sales or average prices by category.
The use cases for graph OLAP databases are vast. For example, building on the above book example, if there was a need for fraud investigation or pricing analysis, graph OLAP databases could be very helpful. Another use case could be finding key opinion leaders and book recommenders using PageRank algorithm. Also, conducting churn analysis to improve customer retention or even doing machine learning analysis to identify the top five factors that are driving books sales.
Graph OLAP Databases Complement OLTP Databases.
Graph OLAP databases complement transactional OLTP databases whether these transactional databases are relational, graph or some other NoSQL database. OLTP databases read and write single records fast. OLAP databases read millions of records fast, but do not read/write individual records fast. Often you need both to create a solution that includes transactional as well as analytic components. Both forms of database can provide real-time data access. Both forms of database can use replication to address more users. Specifically, graph OLAP databases can be scaled by adding additional servers to process the queries in parallel to provide improved computation and performance.
AnzoGraph shards data across the various servers to consider the various servers as one system; a very tough problem but one that the AnzoGraph team has solved previously at Netezza and ParAccel, whose technology was the foundation for AWS Redshift. So, if you need more speed or need to deal with more data, add more graph OLAP servers. Result: AnzoGraph is showcasing up to 200X+ improvement in load speeds, queries and ability to handle larger amounts of data when compared with graph transactional databases (to learn more attend our upcoming benchmarking webinar – see the link below).
As AnzoGraph complements transactional databases, we are partnering with transactional database companies so that it is easier for companies to use transactional databases for building real-time graph applications and use AnzoGraph for graph analytics. Industry standards already makes it easy for companies to use different vendor products. We follow industry standards for graph such as open W3C semantic graph standards based on RDF/SPARQL and soon we will support OpenCypher standards as well. Further, besides adhering to these standards, we are also adding enhancements, for example, to the RDF/SPARQL standards we have added labelled property graph capabilities to provide increased flexibility in doing analytics with industry standard data representation. Beyond, scale, speed and following standards, we also provide a variety of value-add capabilities. We provide Window Aggregates, User-Defined Extensions and BI-style analytics, graph algorithms, and inferencing capabilities, among other capabilities.
As a result, we are seeing very strong interest in AnzoGraph. For the past couple of months, we have offered a 60-day free trial and have seen thousands of Docker.com pulls to use the software in the Cloud (AWS, Google or Azure).
How Can You Learn More?
We encourage you to learn more about graph OLAP databases. Below are the top three most popular Cambridge Semantics’ 2018 blogs or articles based on number of visitors:
- Blog: What is a Graph Database? A quick introduction to graph databases.
- Blog: Understanding Graph Databases. Outlines how graph databases are different from relational databases.
- Slide Presentation: The Year of the Graph. This slide presentation shared at 2018 Gartner’s Data & Analytics Summit, provides a quick overview of why 2018 was considered the year of the graph.
To learn more about AnzoGraph benchmarking, listen to our on-demand webinar: AnzoGraph Database Benchmarking – The Numbers Tell the Story.

