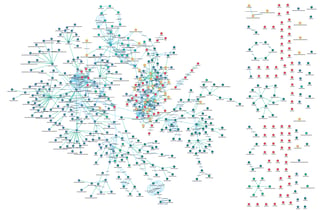
2018 has been touted as "The Year of the Graph", as more and more organizations both large and small have recently begun to invest in graph database technology as they look to draw insights and meaning from existing data resources to streamline their operations. But what exactly is a graph database, and how exactly does it provide meaningful insights into the relationships between your data?

Breaking Down the Basics: Graph Database 101
Graph databases deliver powerful modeling tools that allow end users to discover relationships and connections between data that otherwise could be difficult to see in the real world.
Based upon the concept of a mathematical graph, a graph database contains a collection of nodes and edges. A node represents an object, and an edge represents the connection or relationship between two objects. Each node in a graph database is identified by a unique identifier that expresses key value pairs. Additionally, each edge is defined by a unique identifier that details a starting or ending node, along with a set of properties.
Whereas relational databases store highly-structured data in tables with pre-determined columns and rows, graph databases can map multiple types of relational and complex data. Thus, graph databases are not rigid in their organization and structure, as relational databases are (e.g. MySQL, etc). All relationships are natively stored within the vertices of the edges, meaning that the vertices and edges can each have properties associated with them. This structure allows for a database that can depict complex relationships between unrelated data sets.
Graph databases also boast deep traversal capabilities and can quickly process data and relationships at scale. These databases are schema-less, which allows for flexibility between input data and relationships. Simply put, this allows for more flexibility between how you define relationships between the data sets.
Enterprise knowledge graphs also enable companies to connect all of their data sources to unlock analytics capabilities that are not possible with relational database technologies. Most companies with graph databases already employ Graph Online Transaction Processing (GOLTP) solutions (e.g. Amazon Neptune, Neo4j, etc), used to drill down into the details of specific activities. However, in addition to their GOLTP solution, more and more companies are also employing a Graph Online Analytical Processing (GOLAP) solution to query interconnected facts and relationships across the entire database, and make complex queries often requiring many joins, filters and aggregation – instantly.
So Who Uses Graph Databases?
Because graph databases are well-suited for analyzing complex interconnections between data at scale, they are perfectly positioned to provide value to large corporations and enterprises that involve complex relationships and dynamic schema. Data-intensive industries are using graph databases as an essential analytics offering, to drive quicker access to business insights. These include sophisticated feature sets for training or operationalizing machine learning algorithms in industries for drug discovery, pharmacovigilance, fraud analytics and risk analytics, among others.
AnzoGraph: The Leading Graph Database Solution from Cambridge Semantics
AnzoGraph, Cambridge Semantics' GOLAP database solution, is an in-memory Massively Parallel Processing (MPP) graph database that provides context and meaning at unprecedented scale. AnzoGraph can scale complex graph traversal queries and perform data warehouse-style aggregation analytics of broad swaths of data, accumulated over weeks or even years of transactions, from many disparate GOLTP and other database sources.
Try the free Beta version of AnzoGraph for 60 days to see how it can help your organization make sense of its extensive data assets while quickly discovering valuable new insights and efficiencies that benefit the entire enterprise.
