This blog explores the relationship between data management and AI in the context of knowledge graphs, and offers practical considerations to get started building an enterprise scale knowledge graph.
The Paradox
In Technology Quarterly, published in its June 13th, 2020 edition, The Economist cites a PwC prediction that AI will add $16 trillion to the global economy by 2030. The article goes on to indicate data is a major hurdle to adoption of AI, and a further article in the same section references Kathleen Welch of Cognylitica’s assertion that data wrangling accounts for 80% of time spent on AI projects. To those of us who regularly
attend Gartner keynotes (pre-pandemic) and have our LinkedIn feeds (trained by AI, ironically) locked into the data management world, these trends are old hat — even causing us to convulse just a little whenever a mortal dares cite them, yet again, to kickoff a webinar hawking a data management product or service.
However, hearing them on my morning run, read by the sultry and sophisticated British voice actors of The Economist, flanked by the globally important articles grappling with central bank monetary policies, COVID-19, and racial injustice lended the topic a new gravitas I had never quite appreciated. And so as I continued pounding the pavement, invigorated by the airtime our corner of the world was briefly enjoying on the global stage, I began to think about recent trends in data management — as I sadly often do.
Suppose now that you are leading a team tasked with resolving the data for AI challenge within your business. On Friday afternoon, you and your team take the advice of The Economist and decide to modernize your data management strategy to improve your chances of realizing your share of the $16 trillion forecasted by PwC. On Monday morning, you begin researching possibilities and stumble upon the Enterprise Data Fabric, which is an emerging architecture and strategy for integrating and delivering enterprise data in support of digital transformation activities, including operationalizing AI. In his recent research report The Forrester Wave™: Enterprise Data Fabric, Q2 2020, Noel Yuhanna makes a strong case for an increasingly prevalent recommendation: apply AI and machine learning to accelerate data management.
Did I hear that right? you might rightly ask. Surely we have a cyclical paradox: if you want to succeed at AI/ML then modernize your data management capabilities; if you want to modernize your data management capabilities, then you have to succeed at AI/ML. Now, there are some products designed to help apply AI/ML specifically to data management, but even those fit-for-purpose algorithms require training data. Something needs to prime the pump, and turn this into a virtuous cycle. Enter the Knowledge Graph.
The Knowledge Graph
I have yet to find a definition of Knowledge Graph that is neither indistinguishable from “graph” nor too restrictive (sorry Ontotext, I quite liked yours until you excluded certain things.) I will offer a broad and simple definition: A knowledge graph is a graph used for data management. Or in a more textbook form:
A Knowledge Graph is a connected graph of data and associated metadata applied to model, integrate and access an organization’s information assets. The knowledge graph represents real-world entities, facts, concepts and events as well as all the relationships between them yielding a more accurate and more comprehensive representation of an organization’s data.
Here are a few examples of real-world knowledge graphs we have implemented with customers where every granular data element gets an RDF triple in the knowledge graph.
- All the data generated by machines in an automotive plant including machine codes, failures and time-series data
- Integrated data sets from lab notebooks, laboratory systems, document repositories and relational databases
- Patient result data from many clinical studies including laboratory and genomic data
- Multiple years of a large hedge fund’s trades, prices, emails, chats and call logs.
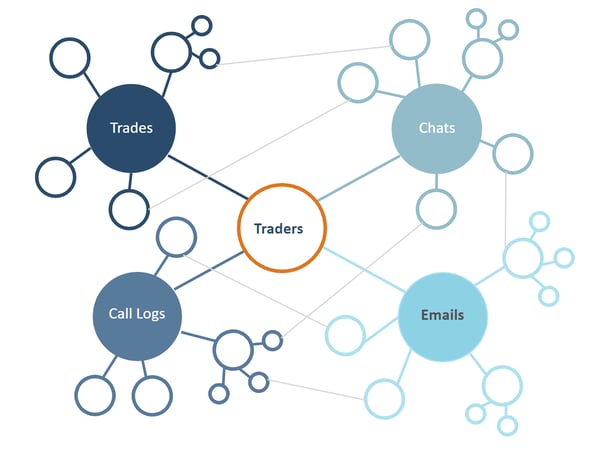 Knowledge Graph for Trade Surveillance
These are large and complex knowledge graphs fed from live enterprise data sources. In a recent article, we discussed how we address this type of scale for graph. The examples above, however, are the endpoints and only part of the picture. The metadata elements within the knowledge graph are essential, for building, maintaining, securing and providing meaningful access to the graph. These metadata elements include:
- Technical metadata automatically harvested and imported from the source systems
- Business metadata describing the concepts, classes and properties across the sources
- Automatically generated semantic graph models (OWL ontologies) that define the expression of a data source and its logical model within the knowledge graph
- Curated or industry-standard semantic graph models (OWL ontologies) that express how users or applications consume, transform and analyze the knowledge graph
- Profiles of all the data in the knowledge graph, organized using the semantic model
- Transformations, rules, derivations, and inferences that describe and automate how parts of the knowledge graph are created or evolved.
- Security rules that determine access control over parts of the knowledge graph (metadata and data)
- Configuration of analytic dashboards and APIs through which users and applications consume the knowledge graph.
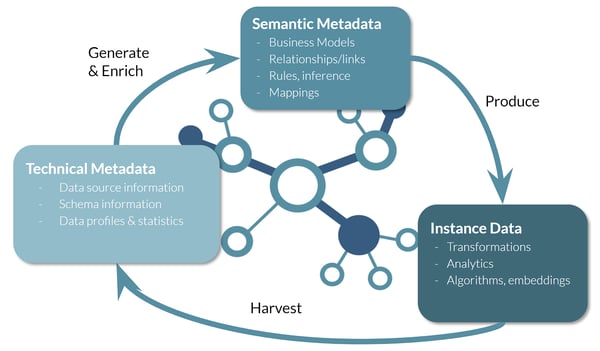
Together, the data and the metadata in the knowledge graph establish a virtuous cycle that breaks the paradox described above. The metadata forms a basis for automating data management that does not require trained machine learning algorithms. Sophisticated, yet deterministic, algorithms harvest technical metadata from source systems or data catalogs. This technical metadata is then used to generate semantic models, mappings, transformations and rules which then produces the instance data in the knowledge graph. Algorithms then run on the instance data in the graph to produce further profiles suggesting additional metadata in the form of mappings and relationships. These algorithms range from matching based on simple heuristics or statistical profiles to more modern approaches including graph embeddings applied to both data and metadata. An important aspect of this cycle is, of course, user input. At each step, users can review, accept, reject or replace any metadata based on their subject matter expertise.
In the Forrester analyst research referenced above, Noel Yuhanna emphasizes the need to apply AI and machine learning methods to automate data management in the enterprise data fabric. Automation is really the central requirement and knowledge graphs provide a practical, yet rich way to reduce the time required to integrate data without having to train machine learning algorithms. By using knowledge graphs to automate data integration at scale, you will be well on your way to building a data fabric that will support your AI and digital transformation initiatives for years to come.
Getting Started
A knowledge graph of all your data and metadata assets develops over time as you implement the enterprise data fabric. However, you do not need to create or even design the entire knowledge graph on day one, but you do need to start somewhere. In his article “How to Build Knowledge Graphs That Enable AI-Driven Enterprise Applications”, Afraz Jaffri introduces some practical guidelines that can substantially help you and your organization break ground on your knowledge graph and data fabric. Afraz recommends starting with a Minimum Viable Graph (MVG) and Minimum Viable Ontology (MVO) to address the data sets, concepts, properties and relationships required for a targeted use case. The MVO and MVG extend, iteratively and in an agile fashion, as use cases expand or new use cases are identified. We guide our customers in precisely this way and have developed our product, Anzo to embody this methodology.
If you have any questions or comments, please email me ben@cambridgesemantics.com or visit www.cambridgesemantics.com to find out more.
Note: This blog post originally appeared on Medium.com on June 29, 2020.