How geospatial in a graph database can take away some of the pain of location analytics
Today, we published a preview of AnzoGraph™ DB with an important new feature - namely geospatial analytics. You can preview geospatial capabilities if you download AnzoGraph DB now and it will be fully available (GA) in all AnzoGraph DB editions in the coming months.
We took some urgency to complete this feature, due in part to the rapid spread of COVID-19. Graph databases like AnzoGraph DB make it possible to load some of the standard COVID-19 data sets, but the use of location analytics to gain new insight on the spread of the virus is a key goal. The AnzoGraph DB development team is hopeful that our developer community will be able to use it to help the world understand COVID-19 and prepare for any future pandemic.
Of course, geospatial has hundreds of other analytical uses as shown below.
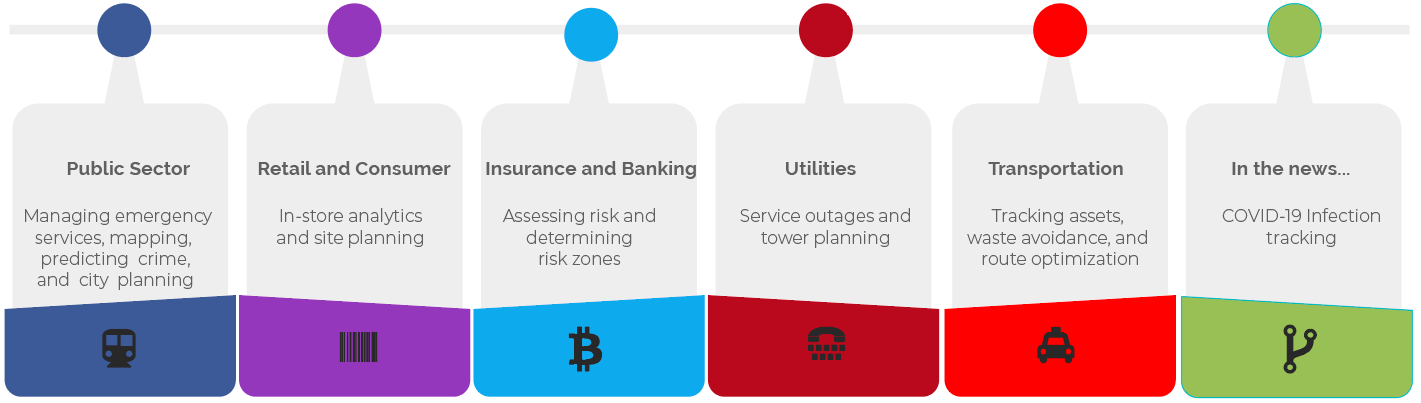
In most of the above use cases, our partners can now use AnzoGraph DB to build a geospatial knowledge graph. Knowledge graphs are becoming important for harmonizing data from diverse sources and allowing users to search, analyze and use the diverse data for AI and ML and to address unanticipated questions. AnzoGraph DB adds a new capability to this arsenal, AnzoGraph geospatial, to improve insights, analysis and visualization from knowledge graphs.
What are the Geospatial Functions?
The specific functions of our implementation of geospatial fall into these four categories.
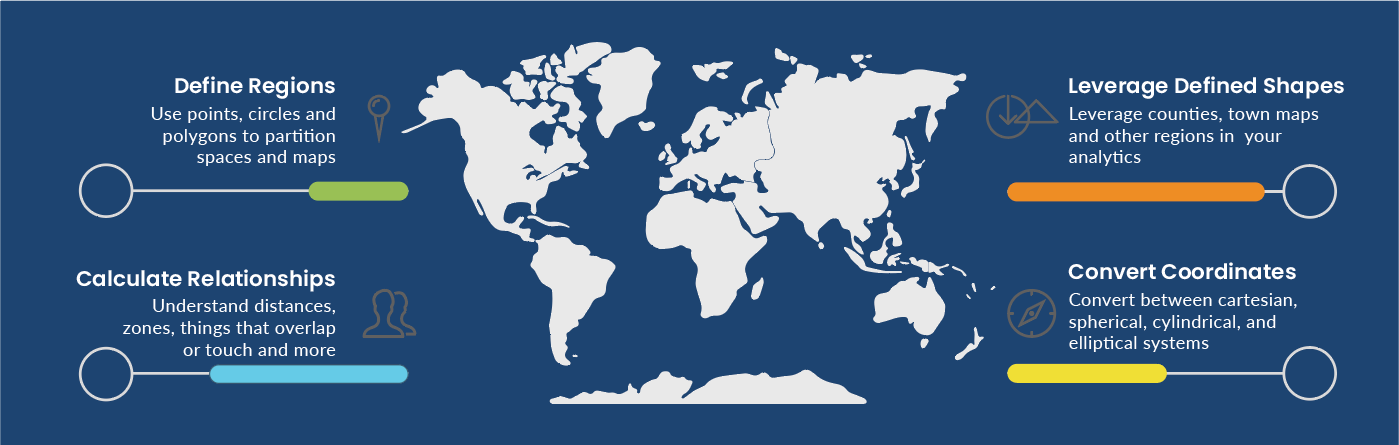
The team has developed this Geospatial and GeoSPARQL functionality in compliance with OGC standards. Use it to develop large scale location intelligence and geospatial applications along-side rich data-analytics using SPARQL* and RDF*. This will be a rolling release, where we initially provide geospatial function calls via SPARQL. GeoSPARQL support is on the way shortly.
Why Graph Database, Data Models and Geospatial?
The graph data model is made for maintaining relationships. Since geospatial is a relationship between people, places, things, and their location, graph databases like AnzoGraph can simplify geospatial analytics.
The graph data model in AnzoGraph DB is useful along with geospatial because:
- Complicated schemas and relationship tables aren’t part of an RDF* graph database like they are when you try to implement in an RDBMS. Everything is a triple in a graph.
- Since you aren’t using relationship tables, you aren’t doing the same costly JOINs. Geospatial analytics in a graph database is highly performant.
- RDF* gives you properties on predicates and with these properties, you can leverage built-in graph algorithms crucial to geospatial like shortest path and connected components to name a few. Graph algorithms will also be performant.
- It lets you integrate any data at any time. No matter if you’re importing data from an RDBMs, from flat files, or from NLP, everything is a triple.
- It is forgiving about sparsely populated data. If the data doesn’t exist, the triple doesn’t exist. It’s also forgiving about new data sources by allowing you to easily add triples when new dimensions are needed.
The First Geospatial Graph Analytical Database
In looking across the market for geospatial capabilities in graph databases, we have noticed that they do exist, but many of them fall short. One market leader and competitor has something they call geospatial, but it seems more to be more like a grid analytics algorithm, allowing you to set up a grid and determine whether a point falls within it; all well and good, but geospatial encompasses much more than that. Life is not always a grid, but an interesting mix of countries, counties, zones, cities, and other irregular shapes to analyze.
Other graph databases have properly implemented geospatial, but are limited to single server implementations that encounter horizontal scale issues as data volumes grow. Performing analytics on any data set north of 40 million triples is apt to cause you some performance problems. For many companies first starting with a graph, the limitation is not an issue. However, the limitation will appear as you scale up. Even in the situation where you’ll never have billions or trillions of triples, you still may have performance problems on analytical functions like counts and averages.
By combining AnzoGraph’s analytical capability, our scalable MPP backbone, and proper geospatial, we really have something unique that can easily scale into billions of triples, or handle fast aggregates.
Where to Try
The AnzoGraph DB geospatial analytics capability is now in preview and available in our free edition as a supplemental download here. Read more about geospatial capabilities in the documentation.