Why Knowledge Graphs are inevitable for the future of data management in the automotive industry.
A typical German car manufacturer on average assembles ~10 cars per minute. Each of these cars consists of dozens of thousands of mechanical, electronic and software components produced and supplied by a few thousand companies. Each individual component has its own lengthy life cycle starting with the definition of requirements and functions through development, testing and production to field usage and service. In addition, each component has various manifestations through e.g. versions, release states, region specific and time-dependent certifications, changes in production processes, prices and my favourite: compatibility rules.

In fact, the chances that you have ever seen two exactly identical cars in your life are fairly low, independent of your age. Just an Audi A6 (C8 Series) has 10³³ possible configurations (10³³ = 1000000000000000000000000000000000). And it’s not just the automotive industry that is facing this level of immense product complexity. Aerospace, mechanical engineering and rail transport industries have very similar challenges:
There are 10⁹⁰ possible configurations of a Siemens Railway System.
Due to mass production and strong dynamics the automotive industry is one of the most complex manufacturing related industries in terms of product data management. Compound this with the fact most car manufacturers do not offer only one single model to their clients. All models must be strongly intertwined as they share parts, delivery trucks and manufacturing lines.
So much data. So many systems. So many users. So many questions. Unfortunately so many different and incomplete answers to the same questions. You can’t blame OEMs for drowning in an ocean of uninterpretable data.
But the data is there. Somewhere. In some format. And there is hope that one day we will have full transparency over everything.
But is it even realistic? Will there be a day where a homologation manager will be able to open a browser and ask:
“Show me all parts used in Model A and Model D, used for production in one of the plants in Poland,
that have a chrome coating and are not certified for Europe starting from 2023.” ?
One might argue we could build a system with traditional technology that would answer similar questions. Well we could, but what if this time a product developer wants to know from the same system:
“What happens to downstream processes in production, supply chain and
services if I change the coating of part X from chrome to nickel?”.
First, this question is much harder to answer with any traditional technology. You would require full integration of the downstream processes making up the product life cycle of the respective part. Secondly, this question is fundamentally different from the first one. It requires a different schema, different set of attributes and information from many different systems, without even elaborating on the problem of data quality within and integration between systems.
Situation
Relational technologies struggle to resolve any of these problems for two reasons.
- The core of all automotive data — product structures and configurations are directed, acyclic and dense graph structures. Relational tables are meant neither for storing nor analysing this type of information.
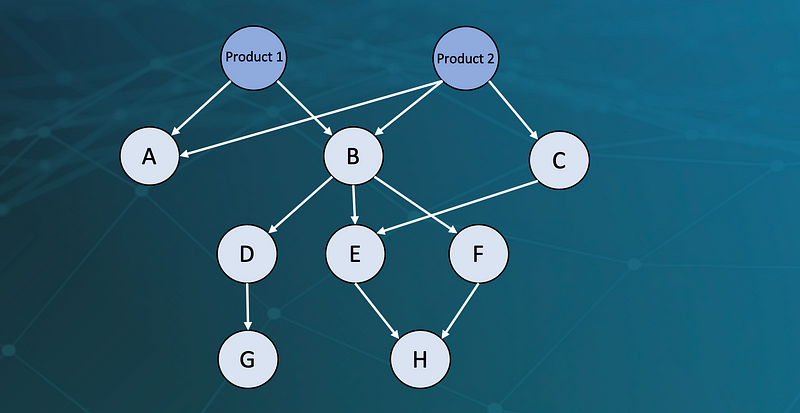
Product structures are multi-dimensional hierarchies - Product Lifecycle Management data is stored in hundreds of different sources (databases, data lakes, PDFs, XML-Files, …) and is constantly changing. A two-dimensional relational schema will always struggle to represent n-dimensional relations and constant schema changes.
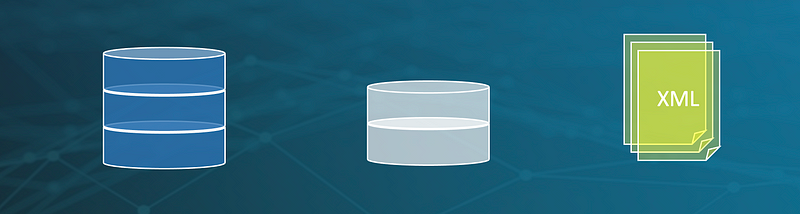
Databases with different schemes, formats and business logic
Complication
Automotive OEMs and their suppliers run into a very respectable amount of problems, especially in terms of data management and governance. Here are a few examples:
- Holistic views on dynamic data that is spread over multiple systems
- Changes of data schemes and business logic
- UNECE regulatory compliance like traceability
- Change propagation throughout life cycle
- Integration of unstructured or raw data
On the other hand insufficient integration and interpretability of data as well as low speed in analysing complex data structure make data analytics difficult, especially if the requirements change or the search space is unknown. Here are a few examples for calculations that are complicated to execute with traditional systems:
- Complex root-cause analysis
- Life cycle cost analysis
- Configuration rule satisfiability analysis
- Intelligent life cycle based part recommendation
- Parent-child part change/release status analysis
- Product structure analytics (shared parts, structural inconsistencies, ..)
These are just a few examples but you basically can add anything that requires accurate, interpretable and integrated data in dynamic environments.
Solution
A “graphy” nature. Tons of data. Many systems. Many data formats. Dynamic environment. Lots of unstructured and raw data. Despite all the complexities and problems we have just discussed, the good news is there is a solution — Knowledge Graphs.
The concept is simple: A semantic layer representing the business logic of the company integrates all source data models and acts as a translation layer between users and the ocean of data: a Knowledge Graph.
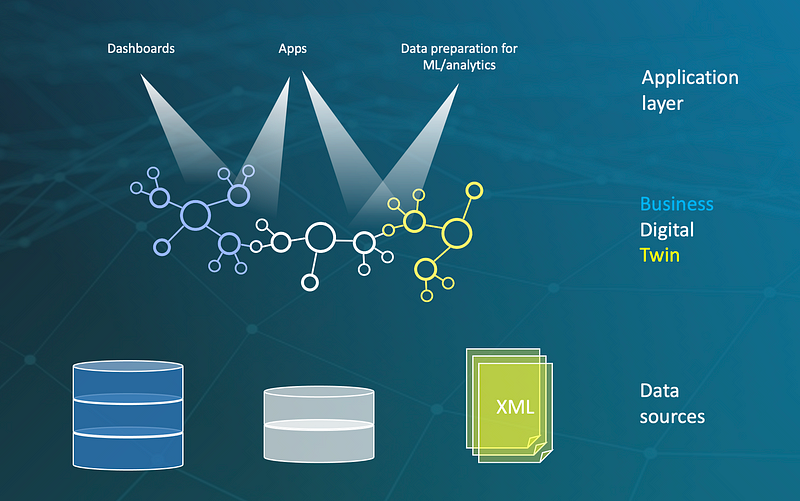
A Knowledge Graph is a light-weight overlay over all data sources in a company representing the business logic of the data
Semantic Knowledge models put every bit of data into context, aligns the meta models of the different source systems and acts as a basis for extracting information from unstructured data as text in order to make the data interpretable.
Lets decompose the term “Semantic Knowledge Model”:
- Semantic description
Enrichment of data and information with machine readable meaning by creation of context to objects. Context is defined by rules and relations between data on meta level and data level. - Ontology / Knowledge Model
Formal representation of knowledge within a domain by definition of terms and concepts and their semantic enrichment — a specification of a conceptualisation. - Graph database
Databases for storage, management and analysis of highly connected data consisting of objects and relationships between them (nodes and edges). Graph databases store Information in directly connected objects instead of tables and thus do not require time costly JOIN-operations. - Semantic Knowledge Model
Class model, data, metadata and rules described by using the formalism of ontologies and stored in a graph database.
Why does the type of Graph Database Technology matter?
There is a fundamental difference between Semantic RDF Knowledge Graphs and Labelled Property Graphs with respect to the problem described above. While LPGs have the advantage of being very easy to model due to a simplified graph scheme they lack features that are crucial to data management such as separation of data model and meta model, standardisation and more. This perpetuates the culture of building a new silo for every new problem. A few features that differentiate the two types of Graphs:
Semantic Knowledge Graphs (RDF Graphs)
- Flexibility and speed when adapting to change
- Upper ontology support (e.g. gist)
- Fully standardised (W3C)
- Rich Knowledge Models
- Built-in data validation capabilities
Labelled Property Graphs (LPGs)
- Fixed schema, re-built for every new case
- Limited ontology support through workarounds
- Not standardised
- No meta model definition, only labels
- No built in data validation as no separation of meta model and data model
Example
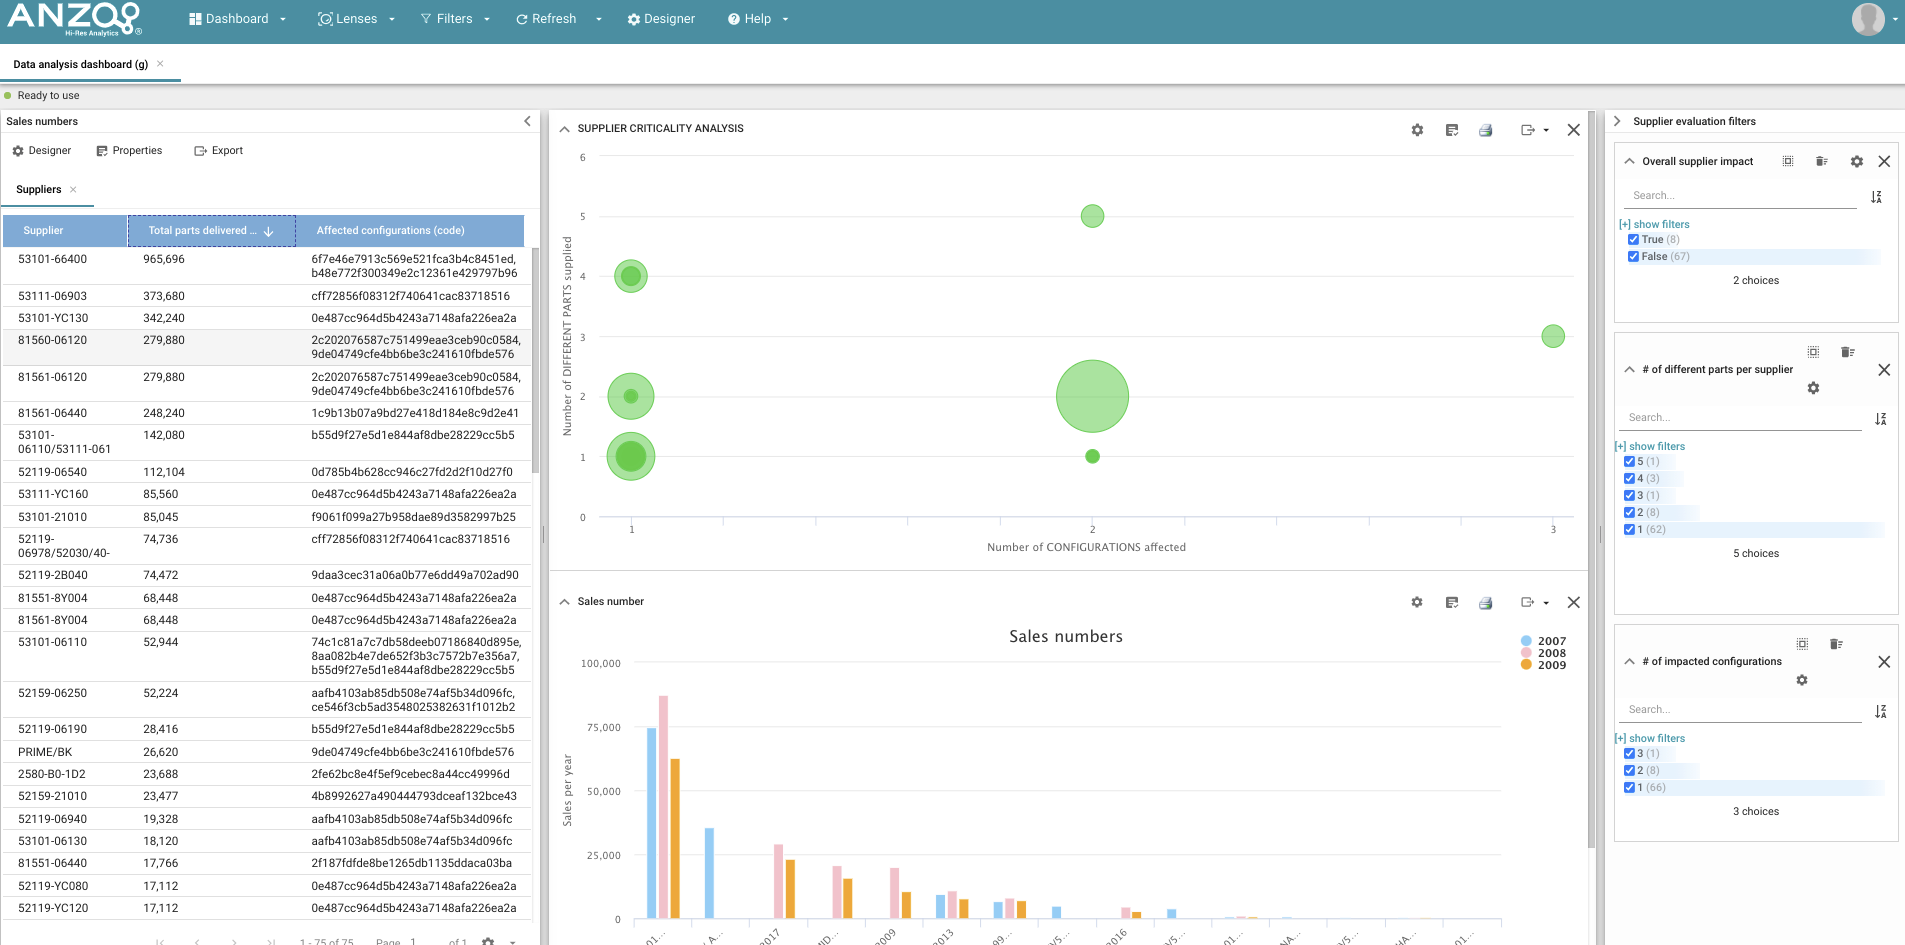
Dashboard from integrated data from 3 sources:
- DB with production/ sales numbers (i.e. MES)
- DB with product configurations (i.e. PLM)
- Sourcing information DB
… to answer a question like:
“Which suppliers/ contracts are most critical to take care of based on the number of different parts supplied,
number of configurations using these parts and production numbers of these configurations?”.
Some other out of the box functions you can use in Anzo (s. below) once turning your data into a Graph:
- Calculate the number of parts for a specific product structure.
- Calculate betweenness centrality for each part of the product structure.
- Show me all suppliers of parts contained in a product structure.
- Show me all configurations where Part X is used.
- Show me all parts in hierarchy level X that are supplied by Supplier Y.
Summary
- Cars are complex products with extremely high component connectivity and a “graphy” nature.
- Traditional PLM Systems are not designed to handle this complexity, semantic graph databases are.
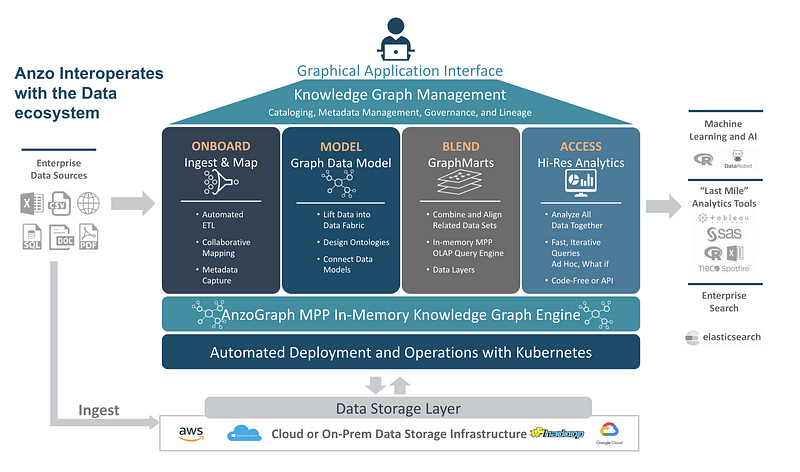
- Cambridge Semantics provides a complete semantic toolchain (Anzo, AnzoGraph) to integrate and consume complex data.
- Anzo does not replace existing ERP or PLM Systems but provides an intelligent layer on top of them to monetise the knowledge stored in source systems e.g. by virtualising the data in them.
- Users can build analytics / ML / Chatbot / NLP / Intelligent Search applications without bothering to understand database specific schemas and data issues.
Anzo - a scaleable knowledge graph platform for data integration and analytics
Anzo is a complete knowledge graph platform built on a high-performance graph database engine, called AnzoGraph, that uses an in-memory MPP processing paradigm to execute queries against datasets extremely quickly, enabling agile data integration, transformation, and analytics at enterprise scale. Anzo leverages standards including W3C’s RDF, OWL, SKOS, and SPARQL to combine knowledge graphs of metadata and data which can be powerfully explored, transformed and analyzed, while also ensuring open data interoperability and easy integration with other systems. Anzo is an open overlay platform that allows users to assemble knowledge graphs against the underlying data resources without displacing or disrupting existing processes or platforms. Anzo integrates with enterprise metadata, governance, security controls and policies, and includes APIs for lights-out integration into other processes.