Hi there, I’m Emily Kallfelz, a customer success manager at Cambridge Semantics.
Here at Cambridge Semantics we build sustainable solutions that break down data silos and enable enterprise collective intelligence. This is accomplished via Anzo, our lightweight knowledge graphs overlay covering all existing data sources, structured and unstructured.
This opens the doors for our customers in many ways. In this blog post, I’d like to speak about a use case I’m very familiar with, how to investigate supply chain fragility.
Leveraging Anzo Network Navigator, a customer of ours was able to perform intuitive analysis into risks that can affect their supply chain, and ultimately influence their manufacturing processes.
Watch my demo titled Supply Chain Risk Analysis with Anzo Network Navigator to explore a knowledge graph for automobile manufacturing supply chain where we look to identify and investigate supply chain fragility.
There are many ways to visualize the Knowledge Graph, but in this demo we start by targeting a specific automobile manufacturer. Anzo displays all of the data available in the knowledge graph, so users can search to find the data they want to populate the graph and can select multiple items. In our example, we start with a can manufacturing group.
As Anzo builds the knowledge graph it then displays for you the incoming and outgoing nodes, which are 40 potential suppliers in the demo. By simply clicking on the suppliers you can visualize the relationships between them and the automobile manufacturer. Since Anzo also provides further associated data, we can easily expand the knowledge network, and in the demo we do this with downstream refineries.
Now, we’re talking car manufacturing, and cobalt is a key raw material for the industry. So it’s helpful to be able to identify if your car manufacturing facility has a supply chain fragility tied to the raw material.
In the demo we look for relationships between cobalt and the refineries and suppliers. Using a few intuitive, visual steps in Anzo, we can easily add the cobalt data across the entire graph network.
The cool trick we use in the demo is “pathfinding.” Pathfinding This is a critical tool in investigating a supply chain weakness as Anzo Network Navigator easily visualies an organization's dependencies. In our example, we find where refineries and/or suppliers are overly dependent on a few mines or countries. When using pathfinding, behind-the-scenes Anzo is generating a SPARQL query to find the relationships between two entities.
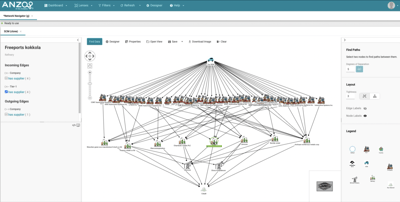 In our example you’ll see how with using the pathfinding tool we were able to add a significant amount of the network to our graph. It then becomes easy to explore the graph further and perform analysis through the hierarchy. At the top of the hierarchy, we have the car manufacturer. Connected to the manufacturer are 40 nodes representing potential part suppliers to the manufacturer. The next layer down and connected to the suppliers are refineries that provide cobalt to tier 1 suppliers. One layer further and connected to the refineries are mining companies that mine and supply cobalt.
If you didn’t investigate as deep as we have into this supply chain, you might assume that having 40 suppliers to 1 manufacturer is an argument for a stable supply chain. However, Anzo Network Navigator clearly shows how many of these suppliers are supplied their materials from the same refineries. Even more concerningly, these refineries are all supplied by only two mining companies.
As if we haven’t already found enough to be concerned about, using Anzo it’s easy to click on the associations with the mining companies to identify the locations of their mines. In our example, we find that all of the mines supplying the supply chain, regardless of mining company, are located in the Democratic Republic of Congo (DRC).
If you’ve been following along, we’ve rather quickly highlighted three areas of fragility in the supply chain:
- All of the manufacturer tier 1 suppliers depend on only a few cobalt refineries.
- These few refineries rely on two mining companies.
- All of the mines that supply these mining companies are located in the DRC.
If you watched the demo, you saw that this analysis only took a few minutes and it’s easy to see how valuable those minutes were, especially if you were this manufacturer. You can even expand upon what was shown in the demo to keep exploring and finding novel insights.
I hope you found this demo helpful and/or inspirational as you start brainstorming how and where knowledge graph can be most valuable in your organization. Please feel free to reach out with any questions you may have.
If you’re interested in exploring more knowledge graph use case demonstrations, I suggest watching our recent Knowledge Graph Demo Showcase.
GARTNER MARKET GUIDE
Analytics and Decision Intelligence Platforms in Supply Chain
