I’m Greg West, Principal Presales Engineer at Cambridge Semantics. What drew me to knowledge graphs and Cambridge Semantics was the opportunity to work with a variety of early engagement clients to understand and help solve their specific business problems. This experience has allowed me to compile comfortability and familiarity with tackling numerous solutions via Anzo, our knowledge graph platform.
I, and the royal we, help build sustainable solutions that break down data silos and enable enterprise collective intelligence. This is accomplished via Anzo, our standards-based knowledge graph overlay that connects all your data sources, structured and unstructured. Helping customers achieve levels of insight and decision advantage that otherwise would not be possible.
So let's talk about a regulatory use case. U.S. regulators, and others, share a problem of needing visibility into all activity around a drug approval process. One of the many problems is the existence of data sources in their own silos, and the need to stitch the data together to tell the comprehensive story.
For example, within the United States, they have:
- Orange Book, which has patent data.
- ClinicalTrials.gov, which has clinical trial data.
- FAERS, which helps adverse event data.
- Drug approval letters, which have all sorts of unstructured data about a particular drug product.
All this data has different formats. They may refer to the same concept using different terms. In this demo we take a look at how we can build a knowledge graph from these different sources.
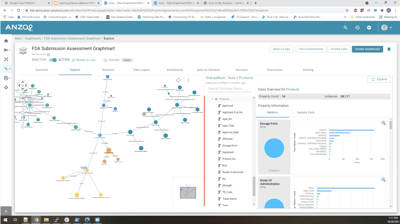
The knowledge graph built in this demo combines data from several sources, and Anzo denotes the different sources by color. In our example there are 4 data sources all mapped together by the idea of a canonical product.
When looking at the graph visualization, the first thing you might notice is that each one of the sources has a slightly different way of referring to what we consider a canonical product. The clinical trials source refers to an intervention, the adverse event source data refers to a drug that was used to treat a patient, and Orange Book (patent data) refers to a product record. These concepts are combined together by a canonical product.
 Before we get into how we tied everything together, let’s start with how we built the knowledge graph. We start with the concept of a Graphmart. A Graphmart can be thought of as the recipe for creating a connected knowledge graph. In the recipe, each layer acts as instructions for:
- Either loading data from a particular data source into the in-memory Anzo GraphDB,
- Or there are additional steps called blending.
What we mean by blending, is that automatically Anzo is using SPARQL to do data transformation, data cleansing, and/or data harmonization between those sources. That's exactly what you see in the demo. The first eight steps are just loading data from different sources and different file formats. Some of the data is CSV, JSON, in a database, or unstructured data sources.
Then we get to the blended steps that define instructions for how to combine sources together into a connected knowledge graph. When you click into one of the blend steps you’ll find a SPARQL query. In the demoed example, the blend layer is an in-memory data transformation. Being able to do this in the in-memory layer is quite powerful.
As you build the knowledge graph in Anzo, you can dive into associated metadata about concepts and their associated properties, and leverage that metadata to find connections between concepts. Anzo will use that metadata to suggest where connections may exist between some of our siloed sources, and allow you to make those links by automatically generating SPARQL blending queries.
Now that you’ve built the connected knowledge graph, there's a couple of different ways to expose that knowledge graph, one of which is Anzo Hi-Res. Anzo Hi-Res is the native BI or access layer for the Anzo platform. You can build different visualizations directly on top of the knowledge graph in a no code environment that will automatically query and expose that knowledge graph in a variety of different ways.
Additionally, Anzo Hi-Res not only builds visualizations, but finds areas in the Knowledge Graph that need additional harmonization and transformation steps. This can then be done quickly using the Graphmart.
I hope you found this demo helpful and inspirational as you start brainstorming how and where knowledge graphs can be most valuable in your organization. Please feel free to reach out with any questions you may have.
If you’re interested in exploring more knowledge graph use case demonstrations, I recommend watching our recent Knowledge Graph Demo Showcase.